Evaluating the Efficiency of Medical Interventions: An Introduction to Cost-Effectiveness Analysis
Cost-effectiveness analysis (CEA) is a statistical method used to quantify and compare the efficiency of different medical interventions. In this article, I will provide a brief overview of the fundamental processes of CEA.
In real-world clinical scenarios, patients and physicians often evaluate different interventions by comparing their costs, prognoses, and risks. However, these informal assessments are often subjective and lack rigorous quantification. In formal scientific and health economics research, a cost-effectiveness analysis (CEA) is utilized to evaluate efficiency statistically.
Basic Concepts of CEA
In this section, several core concepts of CEA will be introduced, including the QALY, Utility, and the ICER.
QALY & Utility
The fundamental metric of CEA is the Quality-Adjusted Life Year (QALY). The QALY provides a quantified value that accounts for both the length of life and the quality of life. It effectively represents the number of perfectly healthy life years an individual gains. Mathematically, it is calculated using the following equation:
where is the utility value at time .
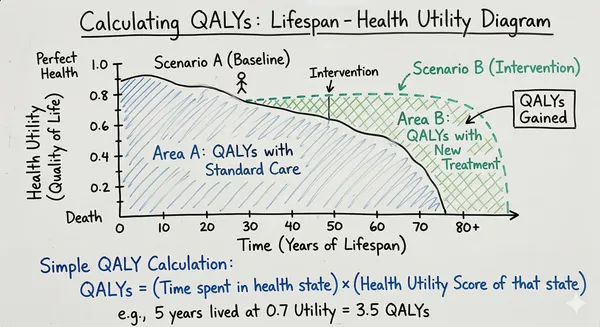
As shown in Fig1, the QALY represents the Area Under the Curve (AUC) of a lifetime-utility graph. QALYs are often evaluated in their incremental form, known as QALYs gained (), which denotes the additional value provided by a specific intervention compared to a baseline scenario (Area B in Fig1).
Utility is the core concept and arguably the most challenging component of CEA. The utility value reflects an individual’s health-related quality of life, where a value of 0.0 represents death and 1.0 represents perfect health. Notably, utility values can be negative, indicating a health state that the patient perceives as worse than death.
ICER
The Incremental Cost-Effectiveness Ratio (ICER) is a statistical metric that directly quantifies the economic efficiency of an intervention. The ICER is defined as the additional cost required for every additional unit of QALY gained, calculated using the formula below:
This ratio provides an intuitive measure of value. ICERs are then compared across different interventions or evaluated against a Willingness-To-Pay (WTP) threshold to determine their overall efficiency and viability.
Assessing Utility
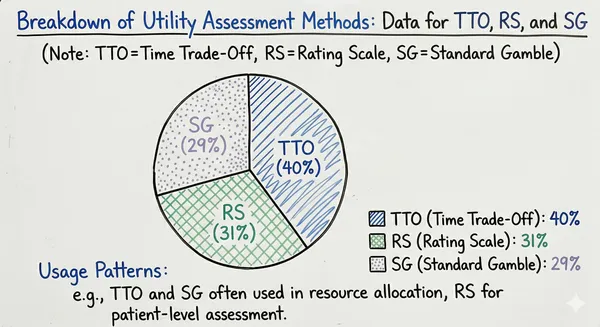
As one might expect, the most challenging aspect and greatest source of variability in CEA stems from the assessment of the utility value. There are several methodologies used to evaluate individual utility. Direct measurement methods include the Standard Gamble (SG) and Time Trade-Off (TTO) models. Indirect methods utilize evaluation questionnaires that are subsequently converted into utility values (commonly referred to as the Rating Scale (RS) method).
Historically, the most widely used method for utility measurement was TTO (40%), followed by RS (31%) and SG (29%) 1.
Direct Methods
Direct methods are generally considered more precise but are cognitively demanding for participants and require significant administrative effort.
The Standard Gamble (SG) model asks participants to choose between remaining in their current suboptimal health state for the rest of their lives, or undergoing an intervention with a probability of achieving full recovery and a probability of immediate death. The value of is iteratively adjusted. When the participant becomes indifferent between the two choices, the value of represents their utility value.
The Time Trade-Off (TTO) model assumes a participant has remaining years of life in their current health state. They are then asked how many years ( years) they would be willing to trade in exchange for living in perfect health for their remaining lifespan. Similar to the SG model, when the participant reaches a point of indifference, the value is considered their utility value.
Both SG and TTO are widely accepted methodologies for directly evaluating utility values.
Indirect Methods: The Rating Scale
Although utility values estimated by SG and TTO models are highly accurate, these direct measurement methods are often too cumbersome for routine clinical application. Consequently, the Rating Scale (RS) serves as a practical alternative.
The RS method requires participants to complete standardized health questionnaires. Their scores are then mathematically transformed into equivalent SG or TTO utility scores. The most widely used instrument for this is the EuroQol EQ-5D. A prominent example is the algorithm developed by Dolan, which converts EQ-5D-3L scores into TTO utility scores.
The EQ-5D-3L is a standardized, widely adopted instrument designed to measure health-related quality of life (HRQoL). It characterizes a patient’s health status across five distinct dimensions: Mobility (MO), Self-care (SC), Usual activities (UA), Pain/discomfort (PD), and Anxiety/depression (AD). For each dimension, the respondent selects one of three severity levels—Level 1 (no problems), Level 2 (some problems), or Level 3 (extreme problems). This classification system generates a descriptive five-digit code (e.g., 11223 or 33333), resulting in 243 unique theoretical health states.
Dolan employed a linear regression model with a specific set of penalty deductions to transform these questionnaire scores into utilities. The mathematical structure is defined as:
where:
- is a constant decrement; when a patient reports Level 2 or Level 3 in any of the five dimensions, an immediate penalty of 0.081 is subtracted from the base score of 1.000.
- is the main effect decrement coefficient, which depends on the severity level of each affected dimension. For instance, Level 3 Pain/discomfort incurs a severe penalty of 0.386, while Level 2 Usual activities only deducts 0.036.
- is an extreme penalty term. If a patient reports Level 3 (extreme problems) in any of the five dimensions, an additional blanket penalty of 0.269 is subtracted.
In addition to Dolan’s algorithm, numerous other studies have developed mapping functions to transform questionnaire scores into SG or TTO-derived utility scores, such as the research conducted by O’Leary et al.2 and Torrance et al.3
Practical Details for Conducting a CEA
The practical application of CEA is considerably more complex than its theoretical framework. Researchers must take numerous variables into account. In this section, we will discuss a few key methodological details encountered when conducting a CEA study.
Discrete Utility Values
The original QALY formula relies on an integral of utility values continuously over time. However, in real-world practice, estimated utility is typically measured at discrete intervals (e.g., months or years), let alone the challenge of accounting for missing patient data.
Fortunately, in certain clinical areas, studies explicitly show that patients without further medical interventions tend to maintain a stable utility value over time. For example, a study by Burn E et al.4 demonstrated that osteoarthritis patients post-intervention (following partial or full knee replacement) exhibit stable utility values and quality of life. Under such circumstances, continuous utility can be approximated using the mean value of consecutive discrete samples. In more volatile scenarios, complex statistical models must be trained and fitted to impute missing data accurately.
Discounting Future Values
In health economics, both future costs and future utility values must be discounted back to their present value at the time the intervention is conducted. This introduces the concept of the discount rate, which is typically established by national health technology assessment (HTA) agencies or official institutions. For a discount rate , a future value is discounted using the following formula:
where is the number of time periods into the future.
Long-Term Estimation and Sensitivity Analysis
The CEA processes explained above are often derived from relatively short-term clinical trials. However, when dealing with non-life-threatening conditions, it is necessary to consider the patient’s lifespan. To address this, comprehensive models predicting life quality trajectories must be constructed. Baseline scores and other clinical variables are used to train these models. Decision trees and Markov models are the standard choices for this type of long-term economic modeling.
Conclusion
In this article, the basic concepts and methodologies of cost-effectiveness analysis have been introduced. However, it is important to note that specific CEA processes, willingness-to-pay thresholds, and methodological paradigms vary significantly across different disease areas and geographic jurisdictions. Consulting region-specific literature and official guidelines is always necessary when conducting formal research.
Wen
Mar 27, 2026
Footnotes
-
Morimoto T, Fukui T. Utilities measured by rating scale, time trade-off, and standard gamble: review and reference for health care professionals. J Epidemiol. 2002;12(2):160-178. doi:10.2188/jea.12.160 ↩
-
O’Leary JF, Fairclough DL, Jankowski MK, Weeks JC. Comparison of time-tradeoff utilities and rating scale values of cancer patients and their relatives: evidence for a possible plateau relationship. Med Decis Making. 1995 Apr-Jun;15(2):132-7. doi: 10.1177/0272989X9501500205. PMID: 7783573. ↩
-
Torrance GW, Feeny DH, Furlong WJ, Barr RD, Zhang Y, Wang Q. Multiattribute utility function for a comprehensive health status classification system. Health Utilities Index Mark 2. Med Care. 1996;34(7):702-722. doi:10.1097/00005650-199607000-00004 ↩
-
Burn E, Sanchez-Santos MT, Pandit HG, et al. Ten-year patient-reported outcomes following total and minimally invasive unicompartmental knee arthroplasty: a propensity score-matched cohort analysis. Knee Surg Sports Traumatol Arthrosc. 2018;26(5):1455-1464. doi:10.1007/s00167-016-4404-7 ↩
Evaluating the Efficiency of Medical Interventions: An Introduction to Cost-Effectiveness Analysis. Syncrex's Mini Lab. 2025.